11 Tips For Improving the Utilization Rates on Medical Imaging Assets
A growing general patient population and an increasing aging patient population are key factors in driving future patient volume growth for imaging providers. According to the Advisory Board’s 2022 Market Outlook, the five-year growth rate for imaging services from 2021-2026 is projected to be up to nine percent, depending on the modality. While the overall growth for imaging services is modest, there’s still pressure to reduce costs while maintaining quality patient care. Add to that historically high rates of burnout and staff shortages, and it’s a very challenging position to be in. While these challenges aren’t likely to subside any time soon, maximizing utilization rates can help reduce these pressures and set imaging organizations up for success.
Regular monitoring and analysis of utilization rates can help imaging providers understand the demand for their services, more effectively allocate limited resources, and better manage costs. This data can also be used to benchmark performance against industry standards and best practices, identify areas for improvement, and guide strategic planning.
With ongoing reviews of utilization rates, imaging leaders can gain valuable insights to help them increase efficiency and achieve a positive ROI for their organization. Following is a list of recommended tips to help imaging providers improve their utilization rates.
Measure Imaging Service Line Asset Utilization
Asset utilization is a key performance indicator (KPI) that measures the percentage of time medical imaging equipment is in use and is a good measure of efficiency for an imaging organization. Imaging providers that maximize their service line’s utilization can improve revenue and profitability for their organization.
 High asset utilization rates indicate that an imaging department is efficiently using its resources and maximizing its revenue and return on capital potential. Maximum uptime, lean clinical workflows, and efficient patient scheduling are all essential to optimizing asset utilization. Any scheduling issues or extended downtime can result in idle machines, negatively impacting efficiency, and imaging service line performance.
To improve utilization rates, it’s important for imaging providers to use a consistent set of metrics to measure their performance against their goals over time. One common metric is average daily utilization, which measures the average number of hours that an individual medical imaging device is in use each day. Another common metric is throughput, which measures the number of radiology exams that are completed in a given period of time. Both metrics can help identify where imaging service line assets aren’t being used efficiently or if there are external issues such as maintenance requirements that need to be addressed.
Using historical utilization data analytics, an imaging provider can identify patterns and use this data to understand where there are opportunities for improvement. These valuable insights offer imaging leaders greater visibility into patient throughput, device utilization, and staff performance versus operational targets. Leaders can use this data to help pinpoint scheduling and workflow issues by identifying patterns across individual and multiple medical imaging devices and sites. This information allows imaging leaders to make more informed decisions on how to best allocate resources.
Standardize Medical Imaging Devices
One of the most effective ways to improve utilization rates and workforce efficiency in an imaging organization is by standardizing within their imaging service line. This can reduce costs by eliminating unnecessary variations in procedures, training, and lessen the need for duplicate medical imaging assets. Standardization also ensures that all imaging procedures are more often performed in a consistent manner, regardless of the facility, location, or personnel involved. This leads to more accurate and reliable results, reduced costs, and increased efficiency.
Standardizing medical imaging devices can increase staff productivity as well. Rad techs typically move between different medical imaging devices within an imaging department. Depending on the department’s structure and the staff’s responsibilities, their workload can be spread across one facility or several sites. Having consistent medical imaging devices with similar interfaces, procedures, and protocols across the imaging department can all help improve staff productivity and increase the utilization of their imaging service line.
When rad techs are using a variety of medical imaging devices and following different procedures, it can take them longer to complete exams. When imaging protocols are standardized to ensure consistency in image quality, the variation in interpretation is reduced, and exam turnaround time is improved. Standardizing the medical imaging devices, procedures, and protocols not only enhances the rad tech’s ease of use, but requires less training and results in better staff productivity and asset utilization.
Minimize Unplanned Downtime
Imaging organizations expect their medical imaging devices to be up and running at optimum performance. The more proactive a service provider can be, the more efficient the imaging department will be. Whether an imaging organization partners with an in-house or an external service provider, the capability to monitor and leverage the imaging service line’s service analytics is a key factor in minimizing unplanned downtime and improving utilization rates.
Download the Service Analytics Datasheet
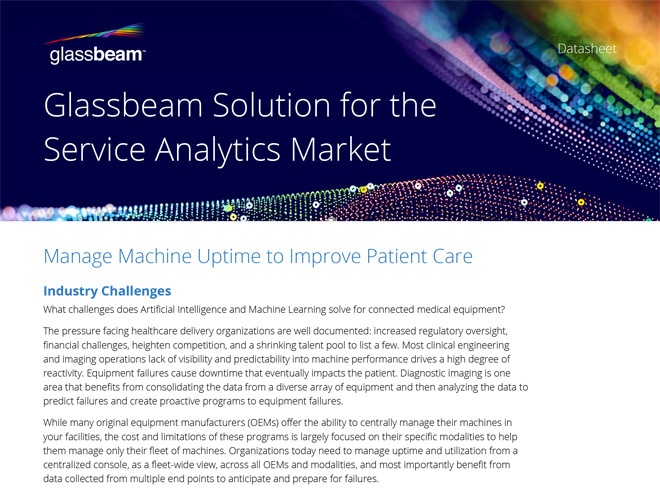
To reduce unplanned downtime, service providers can use technologies with artificial intelligence and machine learning to provide “smart maintenance” that issues proactive alerts and predictive notifications on potential issues. Using remote access to connected medical imaging devices, service providers can proactively resolve many issues at a facility or device level. Some examples of proactive alerts include helium levels, cold head temperature, magnet pressure, scan counts, aborts, and tube arcs for MRIs and CTs.
Service analytics can also provide near real-time insights from environmental sensor data including compressor power, room temperature and humidity, and chiller water temperatures. These proactive alerts not only increase staff productivity and device uptime, but avoid costly and inconvenient exam delays and patient rescheduling.
Service providers can also use predictive analytics solutions to reduce unplanned downtime by predicting potential part failures. This allows the service provider to schedule proactive maintenance for key imaging service line assets, reducing unplanned downtime and downstream impact on an imaging department’s workflow, staff scheduling, and asset utilization. Predictive analytics can also be used to prematurely replace a part versus waiting days for a part to be delivered after the system fails, resulting in more uptime and better utilization rates for the imaging department.
Understand Physician Referral Trends
Physician referrals have a significant impact on a medical imaging provider’s utilization. This KPI measures the referral trends of physicians which is influenced by factors such as the accuracy of results, the ease of accessing reports, and the responsiveness of the imaging center staff. Physician referrals are important to ensure consistent service line volumes and asset utilization.

According to the 2022 Imaging Market Trends Report by Advisory Board, while price transparency tools are offered by commercial payers, only two percent of patients actually use them. Physicians, rather than consumers, are often making referral decisions and those decisions are still based more on the service and relationships with the imaging provider than the cost.
Imaging providers can use data analytics to provide insights into their top referring physicians and identify opportunities for service line growth. These analytics also help imaging organizations align technology and staffing plans with referral volume and mix, so they can be as efficient as possible and optimally support their direct customers.
Optimize Patient Scheduling
Imaging providers can use utilization data to gather patient scheduling insights to guide schedule generation. Providers can leverage this data to create dynamic staffing and patient scheduling models, manage patient flow inside facilities, and share real-time clinical data with the right people and facilities.
With predictive data analytics, healthcare imaging providers can often predict future patient scheduling needs, anticipate workflow interruptions, and share scheduling information to optimize their imaging service line and staff’s capacity.
Real-time information enables imaging departments to book patient appointments strategically. Using predictive analytics, an imaging organization can schedule patients with the same types of exams close together and schedule exams that have a higher variability, such as a patient with claustrophobia, later in the day to minimize disruptions to the schedule. Maximizing scheduling capacity can improve patient access, increase patient volume, and increase imaging asset utilization.
Measure Exam Turnaround Time
Exam turnaround time is an important KPI that measures the time that it takes to complete an individual imaging exam — from the time the patient arrives to the time the results are available to the referring physician. Exam turnaround time determines the number of patients that can receive exams, which can directly affect utilization rates.
Exam turnarounds that are too long create a backlog of patients, deceasing patient satisfaction and reducing revenue because imaging assets aren’t fully utilized. Imaging providers can leverage advanced utilization analytics to gain insights into the root cause for the long exam turnarounds. Using these insights, imaging providers can reduce the turnaround times and increase patient throughput, which in turn results in higher utilization rates.
Depending on an imaging organization’s goals, there are several metrics that can be measured to identify and understand bottlenecks or breakdowns in turnaround times. One Example is the exam completion rate. This metric measures the percentage of exams completed within a certain timeframe. Imaging organizations can use this metric to identify any inefficiencies in the exam process and make changes to streamline procedures and improve exam completion rates, which can result in better utilization rates.
Track Exam Volume Metrics
Exam volume is another important KPI, detailing the number of imaging exams performed by a healthcare imaging provider in a given period of time. Exam volume can be segmented by the type of imaging exam, patient population, modality, asset, or facility. Tracking exam volume allows imaging providers to gain valuable insights that can be used to increase efficiency, optimize asset utilization, and reduce costs.
Exam volume directly affects the capacity of the imaging service line. By tracking exam volume, imaging providers can identify areas where processes can be streamlined, and quality can be improved. This can lead to improved efficiency and utilization rates. If exam volume is too low, the imaging assets won’t be fully utilized, nor will the staff. And if the exam volume is too high, there can be longer wait times and potentially more equipment downtime if assets are overused.
Imaging providers that track exam volume can identify if there are certain times of day or days of the week when the volume of exams is particularly high. Providers can then use this information to optimize staffing and hours of operation, load balance across facilities, or adjust working hours. This not only improves efficiency and utilization, but also staff satisfaction.
Exam volume data can also help identify if certain types of exams have a higher rate of errors than others, which can negatively affect asset utilization rates. This data can be evaluated by imaging leaders to determine if more rad tech training is needed to improve the speed and quality of exams or if there’s an issue with a medical imaging device.
Increase Staff Productivity
Staff productivity measures the efficiency of the radiology staff in completing exams within a given timeframe. By monitoring this KPI, imaging organizations can identify any inefficiencies in the staff’s work processes and make changes to improve productivity and reduce exam turnaround time.
Imaging leaders can combine both utilization analytics and uptime data to determine if the staff is productive and working to fully utilize the organization’s imaging service line. Imaging providers can also use data analytics to proactively schedule maintenance based on slot availability and better manage exam throughput. And finally, advanced data analytics can also help providers identify top referrals, rad tech productivity, and asset utilization versus target used across sites. Exams can be analyzed by CPT code and duration to help imaging leaders identify outliers that need to be addressed.
By monitoring staff productivity and tech productivity across the service line, leaders can compare results against internal and industry benchmarks to ensure their staff are achieving the metrics and goals established by the organization. It’s also important for imaging leaders to share these utilization analytics and metrics directly with their staff. This not only helps ensure the techs are aware of how they are directly impacting the department’s goals, but also how their day-to-day tasks impact utilization rates. This data can provide rad techs with a clear picture of how they can help increase utilization rates.
Use Analytics to Inform Staffing Decisions
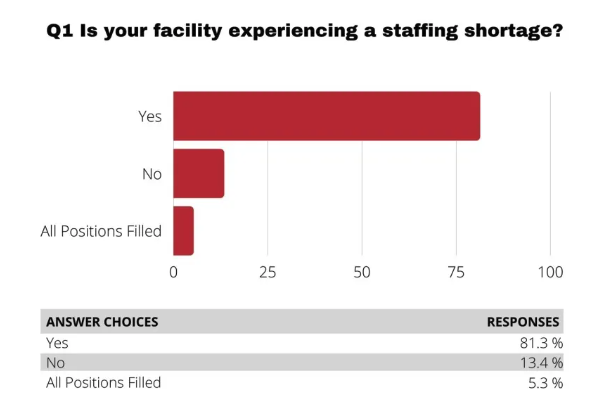
According to a survey conducted by the Area Health Education Centers, approximately 81 percent of imaging departments report staffing shortages. Due to these historically high shortages, staffing decisions require more thought and attention than before.
Staffing decisions and the hours of operation have a significant impact on an imaging service line’s utilization rates. Imaging leaders can use data analytics to understand tech utilization and how much time individual techs are taking to perform each exam, compare that data to the work orders, and get a sense of utilization.
The skill level of staff members and how many staff are scheduled can also affect the efficiency of the imaging organization and the number of exams that can be performed. If staffing levels are too low, medical imaging assets may not be fully utilized, resulting in reduced efficiency and longer wait times for patients. This can lead to longer turnaround times for exams and decreased patient satisfaction.
Staffing decisions are usually made to accommodate the volume of exams scheduled and to optimize equipment utilization. Imaging leaders can use real-time utilization analytics to help determine appropriate staffing levels or qualify a root cause to staffing inefficiencies. For Example, if the data indicates high utilization numbers, imaging leaders can evaluate and determine if that means a rad tech is very efficient or if the rad tech is more idle and not logging out between exams. This utilization data allows the imaging department to plan staffing, recalibrate shifts, and look for staff inefficiencies, all resulting in better productivity and utilization rates.
Identify Training Needs
Utilization rates are directly affected by the competency and skillset of the imaging staff. Arming them with the appropriate training and education for new imaging systems and software is crucial to the organization’s utilization rates. Staff whose skills aren’t current can result in higher patient wait times, exam errors, or re-takes. Providing adequate training for staff and ensuring that they are knowledgeable and confident in executing their tasks can help them be more efficient and utilize the imaging equipment optimally.
Using the right data analytics, imaging leaders can better understand other challenges rad techs may have and identify key training opportunities. Imaging leaders can draw insights from the data to evaluate if certain rad techs take longer than others to complete an exam or if older imaging devices take longer to do particular exams. There may also be opportunities to identify if a faulty machine requires a restart to complete a certain exam. Combined with machine data analytics, root cause can often be identified and addressed, resulting in increased staff productivity and utilization.
Maximizing Service Line Utilization
Regular monitoring and analysis of the KPIs, metrics, and data mentioned above is key to improving utilization rates in an imaging organization. By maximizing utilization, imaging providers can increase efficiency and reduce their costs. But, to achieve this goal, providers must address several challenges that often affect utilization rates, such as unplanned downtime, staff productivity, physician referral rates, and scheduling inefficiencies.
Addressing these challenges requires a strategic approach with clear goals and metrics cascaded throughout the organization. Investing in technologies such as artificial intelligence and machine learning can provide valuable insights, including prescriptive, actionable recommendations. This actionable data not only helps increase efficiency but it also helps imaging leaders provide the best possible patient care.
Imaging organizations that address these challenges and leverage this healthcare business intelligence will have a more complete picture of how their operations function and the key levers to affect their businesses performance. Over time, this will result in both a higher return on investment and a stronger competitive position in their market.
Explore the Possibilities
With more than 1 million exams examined each day by Glassbeam solutions, see how top organizations are transforming their log data into impactful insights.
Transform Your Healthcare Operations
See how to gain deeper, clearer insight from your machine data to elevate business intelligence and to improve your operational uptime, utilization, and efficiency.