ClinsightsTM Utilization Analytics

Become More Proactive and Data Driven
While data exists to create and track asset utilization and staff productivity, it is often siloed into multiple applications, presenting hospitals with the daunting task of analyzing a variety of data sources together.
Clinsights Utilization Analytics provides insights into the operations of your Imaging department by combining logs, DICOM, HL7, RIS, EMR, billing and scheduling data; allowing imaging teams to optimize workflow, operator performance and patient satisfaction.
Optimize Utilization and Exam Volume
Understand exam volume by modality, asset, or facility effortlessly
Referrals
Measure top physician referral patterns to target opportunities for growth
Staff Productivity
Monitor productivity across facilities and modalities to optimize access and cost
Enhance Patient Experience
Discover areas of optimization to improve the patient experience
Preview the Utilization Analytics Dashboards
Preview the features and dashboards within the Utilization Analytics suite
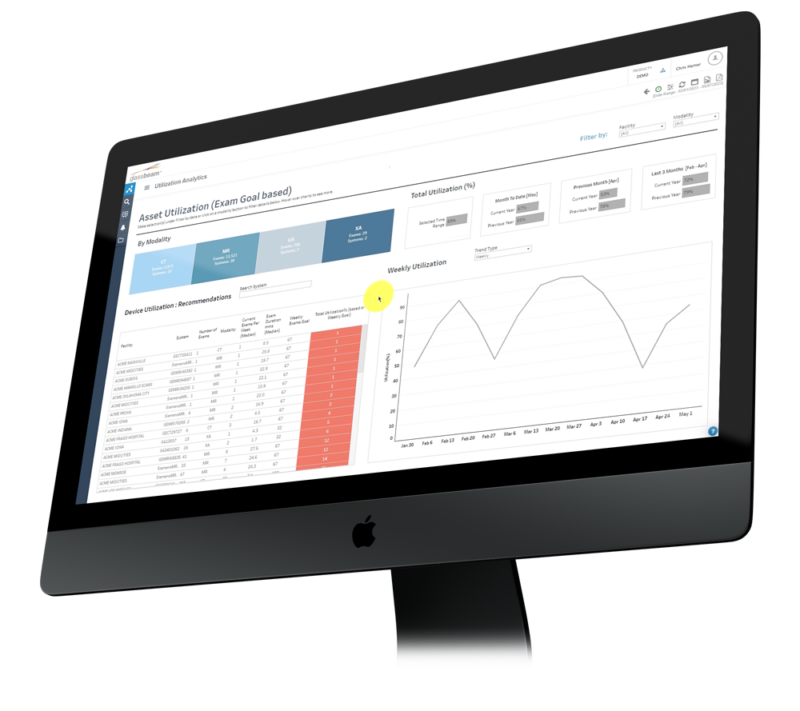
Clinsights Utilization Analytics Features

Data Doesn’t Lie
Utilization Analytics provides a 360-degree view of asset utilization across all OEMs and modalities:
- Set performance targets and track Volume across all sites and modalities
- Asset Utilization – Monitor machine use in real-time on a monthly, daily or hourly granularity
- Tech Productivity trends – compare utilization and long running exams to identify training needs
- Procedure Analysis – Query distribution of procedures across systems and operators
- Referring Physician – Monitor referral leakage by analyzing patterns in referrals and creating awareness
- Monitor turnaround time by subspecialty, facility and physician
Manage Your Entire Imaging Fleet
Improve machine uptime across modalities and manufacturers leveraging machine data and ML/AI powered analytics.
- View alerts and warnings across all modalities and manufacturers in a single pane of glass.
- Act on recommendations to shift unplanned downtimes into planned maintenance windows.
- Deliver business impact with greater machine uptime, operational efficiency and improved service KPI’s [mean time to resolution (MTTR), mean time between failures (MTBF), and first-time fix rate (FTFR)]

Optimize Staffing and Patient Scheduling
Glassbeam provides real time prescriptive insights and comprehensive utilization information to optimize staffing and patient scheduling .
- Staffing gets easier – schedule staffing of all personnel and especially top of license radiologists based on patient demand.
- Schedule staff for training by reviewing statistics on “retesting” due to operator error.
- Enhance patient experience: Reduce wait times, avoid rescheduling and travel

Dive into causes for low productivity and underutilization
Customizable settings allow you to qualify performance at the facility, modality, operator and exam level to understand root cause and optimize performance.
- Identify top exams, operators, and assets used across sites
- Analyze exams performed by modality by use and duration
- Identify outliers to address performance issues, workflow and define training opportunities
- Optimize staffing and hours of operation
Optimize schedules and utilization
Track every visit by patient and the exams performed.
- Identify prevalence and cause for exam start delays
- View delayed exams by facility, modality, operator and day of week
- View change over times by facility, modality, operator and day of week
- Understand long change over time root causes

Manage Assets and Turnaround time
- See assets categorized by age, vendor, modality
- Understand your install base attributes and use
- Monitor time from Scan complete to Final Report
- Filter by Sub-specialty, Referring/Reading Physician and request priority

Understand Referrals
Measure top physician referral patterns to target opportunities for growth
- Align technology plans with referral volumes and mix
- Establish alert thresholds to optimize referrals from internal and out-of-network physicians

View Dose over DRL cases
Automatically collect radiation dosage across facilities, modalities and manufacturers
- Identify and investigate outliers based on ACR reference dose levels
- Filter by Operator, Device or Exam time
- Monitor total effective dose by patient over time
“Today, healthcare providers’ clinical engineering, radiology, and service teams lack the data-driven insights to make effective CAPEX and OPEX decisions. As a result, their organizations fail to maximize machine uptime and reduce operating and maintenance costs as much as possible. Partnering with Glassbeam enables RENOVO additional capabilities to better leverage the analytical data generated by ultrasound modalities. We look forward to optimizing healthcare providers’ return on investment and improving the patient experience through increased uptime.”
Get Clear Healthcare Operations Insight
Gain deeper, clearer insight from your machine data to elevate business intelligence, minimize unplanned downtime, increase asset utilization, and drive operational efficiency.